For anyone who has ever wondered what truly lies beneath the hood of their Windows PC—beyond basic specs—SIV (System Information Viewer) is the answer. It transcends being a simple hardware checker; it's a comprehensive, free diagnostics and monitoring suite designed for power users, IT administrators, and hardware enthusiasts. Version 5.84 continues this legacy, offering an unparalleled depth of information in a compact, portable package. This guide will teach you how to leverage its full potential and determine if it's the right tool for your technical arsenal.
What is SIV (System Information Viewer)?
SIV is a powerful, all-in-one system information and real-time monitoring tool for Windows. Developed by Ray Hinchliffe, its core philosophy is to provide exhaustive detail about every aspect of your computer's hardware and software. Unlike mainstream tools like CPU-Z which focus on concise summaries, SIV dives deep, offering granular data on everything from CPU cache hierarchies and PCIe bus configurations to real-time sensor readings and network adapter details. Weighing in at just over 30MB for the latest v5.84, it is a lightweight yet immensely powerful application that can run without installation, making it perfect for portable diagnostics.
Getting Started: A Step-by-Step Guide to Key Features
Phase 1: Initial Setup and Navigation
1. Download and Run: Obtain SIV v5.84 from its official source or trusted repositories. The package is a ZIP file; simply extract it and run the appropriate executable (`SIV64X.exe` for 64-bit systems). No installation is required.
2. Set Your Language: The interface defaults to English. To switch, right-click the "Copy" button in the bottom-left corner, navigate to Language -> Chinese (Simplified) for a partially translated interface.
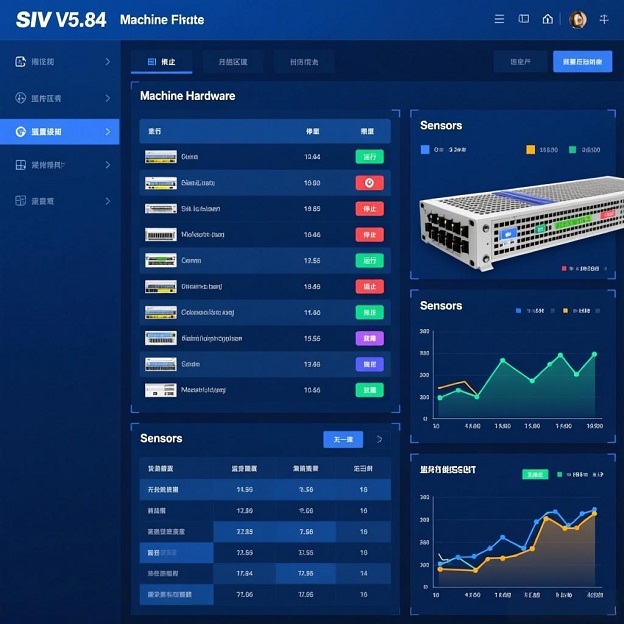
3. Understand the Layout: The main window presents a system summary. The real power lies in the dropdown menus and buttons along the bottom. Key panels include Machine (hardware inventory), Status (real-time graphs), Sensors, PCI Bus, USB Bus, and Network.
Phase 2: Core Usage and Diagnostic Techniques
1. Hardware Inventory & Compatibility Checking:
Click the Machine button. This is your central repository for static hardware data: CPU model, core/thread count, cache sizes (L1/L2/L3), motherboard chipset, and detailed memory SPD data including manufacturer and timings.
Use Case: Before a RAM upgrade, check the SPD tab to verify supported frequencies and compatible JEDEC profiles for your system.
2. Real-Time System Monitoring & Sensor Tracking:
Click the Status button for dynamic graphs of CPU load, memory usage, disk I/O, and network traffic.
Click the Sensors button for the most critical live data: temperatures for CPU/GPU/motherboard, fan speeds (RPM), and voltage readings for critical rails (e.g., +12V, +5V, VCore). This is essential for stability testing and thermal diagnosis.
3. Deep-Dive Bus Analysis (A SIV Specialty):
PCI/PCIe Bus: Click PCI Bus to see every device on these buses. You can view vendor/device IDs, examine Base Address Registers (BARs), and even dump the full PCI configuration space—a feature that replaces the outdated `pcitree` tool and is invaluable for driver developers and hardware troubleshooters.
USB Bus: Click USB Bus to enumerate every connected USB device, down to the hub port, Vendor ID (VID), Product ID (PID), and speed. This helps identify malfunctioning devices or driver conflicts.
4. Network and System Tools:
The Network section provides details on adapters, active connections, and even includes utilities for changing a MAC address (where supported) and performing port scans.
Under the Windows menu, you can review system information, running processes, and service details.
Phase 3: Advanced Tips for Power Users
Export Reports: Right-click anywhere on most panels and select Save to export the information as an HTML or CSV report. This is perfect for system documentation or seeking remote technical support.
Command-Line Parameters: SIV supports command-line options for specific scenarios. For example, using `-SCSI` can help read SMART data on some older NVIDIA chipset systems, and `-DELL` can enable sensor reading on certain Dell machines.
Portable Toolkit: Keep the entire SIV folder on a USB drive. You can now perform consistent hardware audits and diagnostics on any Windows machine without leaving a trace.
In-Depth Review: SIV v5.84
Core Strengths & Advantages:
Unrivaled Depth and Breadth: SIV's greatest asset is the sheer volume of information it surfaces. It combines the hardware listing of tools like HWiNFO with bus-level debugging capabilities, all in one interface.
Zero-Cost and Portable: Being completely free, without ads or bundles, and requiring no installation, makes it an incredibly accessible professional tool.
Real-Time Monitoring Suite: The combination of sensor tracking (temps, voltages, fans) with resource graphs (CPU, RAM, disk) provides a comprehensive overview of system health and performance under load.
Essential for Hardware Troubleshooting: Its detailed views of PCIe and USB devices are often the fastest way to identify hardware conflicts, verify device detection, or gather IDs needed for driver searches.
Considerations & Limitations:
Steep Learning Curve: The interface is dense, information-rich, and prioritizes function over form. Beginners may find it overwhelming compared to cleaner tools like CPU-Z.
Potential for Sensor Misreading: As with any monitoring software, sensor data accuracy depends on underlying hardware support. In rare cases, readings may be incorrect or unavailable, though command-line options can sometimes help.
Incomplete Localization: While a Chinese language option exists, the translation is often only partial, leaving many technical terms in English.
Who Should Use SIV?
IT Professionals & System Administrators: For auditing network PCs, diagnosing hardware issues, and generating system reports.
Hardware Enthusiasts & Overclockers: For meticulous monitoring of voltages, temperatures, and stability during tuning sessions.
PC Builders & Upgraders: To verify component compatibility, check detailed RAM timings, and ensure all new hardware is correctly detected.
Developers & Technicians: Who need low-level bus information for debugging hardware drivers or embedded systems.
Final Verdict
SIV v5.84 is not the prettiest tool, but it is arguably one of the most potent and informative free utilities for Windows. It serves a unique niche, bridging the gap between user-friendly system summaries and professional-grade hardware diagnostics. If your needs extend beyond "what CPU do I have?" to "why is my PCIe device not working at full speed?" or "what is the exact voltage on my +12V rail?", then SIV is an indispensable, powerful, and utterly free addition to your toolkit. For sheer informational depth, few tools can compete.
Official Download Address:
You can download SIV (System Information Viewer) v5.84 from the official website or trusted software archives. For the latest version, it is recommended to visit: https://www.sivtools.com/download.
For users who need to keep an eye on their CPU and memory usage right on the desktop, you can use the O&O DeskInfo tool we've reviewed. For monitoring more granular GPU metrics, HWiNFO is another professional tool in the same category.